Many of the trade policies of the United States President Donald Trump’s administration are aimed at addressing the perceived adverse impact of trade on the country’s manufacturing employment, and improving trade deals the President sees as not being in U.S. interests. These appear to be worthwhile goals, but crafting trade policy to address them is difficult. If not done correctly, the policy could do more harm than good for manufacturing and the broader economy, particularly if the U.S. implements more protectionist policies, or if its trading partners retaliate.
The following article discusses the global economic impact of three different trade scenarios that illustrate how selected tariffs would have only a minor economic impact, but an all-out trade war with tariffs placed on all goods traded between the U.S. and China would have palpable consequences.
Expected tariff scenario (50 percent probability)
The most recent salvo in the trade war is the U.S. decision to up the ante on the amount of Chinese imports to the U.S. subject to higher tariffs. The U.S. has imposed tariffs on US$311 billion in imported goods from China. Under this scenario, the assumption is that this is the fullest extent of the tariffs the U.S. imposes and that there is no further retaliation and only US$134 billion in U.S. exports are slapped with tariffs.
If this is the extent of the tariff increases, then while not good for the U.S. and global economies, they will be able to largely shrug it off. We predict that U.S. real GDP will be reduced by just about 0.13 percentage point at the peak of the impact a year from now. More than 200,000 jobs will be lost over the period. The economic impacts outside of the U.S. will be comparable.
Cushioning the impact of the higher tariffs on the U.S. economy is the massive fiscal stimulus—deficit-financed tax cuts and government spending increases—that will pump up growth through to at least the middle of next year. For context, this stimulus is expected to add 0.4 percentage point to real GDP growth this year, and a like amount in 2019.
Mapping the economic consequences
Higher tariffs hurt the U.S. economy most directly and quickly through higher prices for imported goods. The tariffs act much like a tax increase, weakening the purchasing power of households—if households need to spend more on imported goods, they have less income to spend on other things.
Of course, exports also suffer as the tit-for-tat tariffs imposed on trading partners cause their consumers and businesses to purchase what they need domestically or from competing nations that can now provide the goods more cheaply. Chinese authorities have significant control over the economy and, in previous trade tiffs with Korea and Japan, have strongly recommended to their citizens not to buy the products of those countries. China has not gone down this path with the U.S. yet, but it is a credible possibility.
The higher tariffs also weigh on the profitability of multinationals and their stock prices. This occurs via a somewhat stronger U.S. dollar, as the trade tensions create a risk-off environment in global financial markets, and for U.S. companies, weaker overseas sales. The resulting flight-to-quality lifts the dollar’s value, which weighs on U.S. exports.
In the longer run, the reduction in trade weighs on productivity growth, as the benefits of comparative advantage—when nations specialise in what they are especially good at producing—and global competition are diminished. More broadly across Asia, the impact would be modest. In this scenario, China’s GDP growth is reduced by 0.03 percentage point in 2018 to 6.7 percent, and the brunt of the tariff impact will be felt in 2019 with GDP falling 0.09 percentage point below the no-tariff baseline to 6.3 percent.
The tariff increases translate to lower demand for Chinese exports from the North American market. Exports remain a critical growth driver, comprising 20 percent of GDP. Reduced export revenues translate to lower manufacturing output, flowing through to weaker employment growth. The unemployment rate holds at baseline levels through 2023, but the relative stability masks weakness that sees consumption soften and drives down house price growth by 0.14 percentage point in 2019 to 2.8 percent.
China’s stock market is the most sensitive metric examined under this scenario and reflects investors’ rising concerns about the implications of a trade war on China’s economy. While the stock market is not highly correlated with GDP, it is viewed as a decent barometer of sentiment. The rise in the FTSE Xinhua is estimated to be 1.16 percentage points lower at 4.6 percent in 2019. There is some recovery in 2020 with the annual rise picking up to 6.3 percent, stronger than the 5.4 percent rise under the no-tariff baseline.
If this is the extent of the tariff increases between the U.S. and China, economies in Asia will not be immune to the trade skirmish, but the hit to GDP growth is negligible and forecast variables stay close to baseline levels. The hit to GDP growth largely comes from the export channel as Asia is an important provider of inputs for Chinese manufactured goods, particularly technology producers Malaysia, Singapore, Taiwan and Hong Kong, where technology products comprise a sizeable, if not the largest, share of exports. Based on a simulation of the Moody’s Analytics global model, which covers 68 countries linked via trade flows, foreign direct investment, and financial markets, real GDP growth in Asia is reduced by only 0.08 percentage point by 2019, with an even more negligible impact of around 0.02 percentage point in 2018.
Reduced global trade flows drag on commodity prices and have a pronounced impact on commodity export-oriented countries such as Australia and Indonesia. China’s softer GDP path hurts iron ore prices, which remains Australia’s largest export, with China the largest export destination. Indonesia’s important commodity exports to China include coal, petroleum gas, and crude petroleum.
A slowdown in regional demand will also hurt India’s petroleum-related exports. While India is a net oil importer, exports of refined petroleum products still account for a large part of export values. As regional demand slows, demand for refined products such as diesel, oils or other fuels is likely to drop. Moreover, chemical product and engineering goods exports will decelerate as demand in major export destinations such as the EU is likely to be lower.
The reworking of the global supply chain, when it occurs, will be highly disruptive, and is only partially picked up in our model. The manufacture of many goods involves multiple cross-border movements. Indeed, the U.S. trade deficit with China is significantly inflated, because China is simply where the final assembly of many components produced in Japan and elsewhere in Asia occurs. Higher tariffs change the economics of the supply chain. If the tariffs remain in place long enough, they will cause the chain to shift.
Threatened tariff scenario (40 percent probability)
It appears increasingly likely that the trade war will escalate, given the rhetoric and the apparent lack of a clear path to resolution. This scenario assumes that all tariffs that the U.S. has threatened are implemented, including a 15 percent average tariff on US$800 billion in U.S. imports, and US$275 billion in vehicle imports subject to a 25 percent tariff. This scenario also assumes a 15 percent tariff on an additional US$475 billion of U.S. exports. If implemented, close to one-third of all imported goods into the U.S. will be subject to higher tariffs.
Assuming that impacted U.S. trading partners respond with in-kind tariffs on U.S. goods, the macroeconomic consequences would be more serious. Using our global model, such an escalation would reduce U.S. real GDP by 0.5 percentage point and employment by 700,000 jobs at its peak. This is still not enough to derail the fiscal-stimulus-fuelled economic expansion, but it would be enough to be felt, particularly in the U.S. agricultural and manufacturing industries.
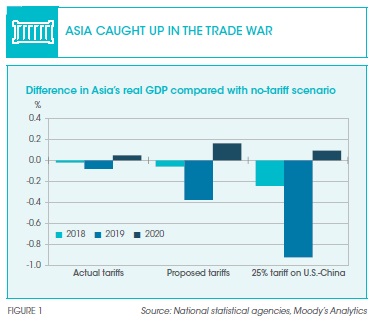
In this trade war scenario, real GDP growth in Asia is reduced by around about 0.06 percentage point in 2018 and 0.38 percentage point in 2019 before recovering in 2020 (refer to Figure 1). China’s GDP growth falls by 0.07 percentage point in 2018 to 6.6 percent and is 0.42 percentage point below the no-tariff baseline in 2019 to 5.95 percent. Annual GDP growth improves by 2020 with growth coming in 0.24 percentage point above the projected no-tariff baseline growth rate at 6.1 percent.
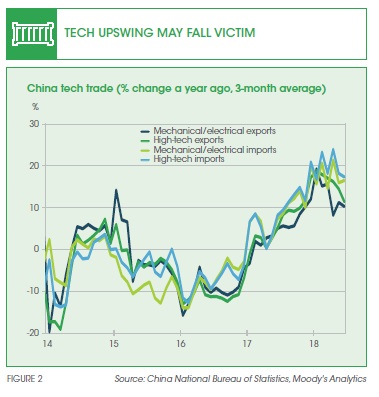
The tariffs are like a hefty import tax, reducing demand for Chinese goods in the U.S. Other important markets, including Europe and Asia, are unable to sufficiently pick up the slack from weaker U.S. export demand. Tech products are an important focus of the U.S. tariffs on Chinese goods imports, and this takes the wind out of the global tech upswing that China has benefited from for over a year (refer to Figure 2).
The Chinese government has increased its fiscal and monetary stimulus (that it has already stepped up since the trade war escalated earlier this year), but these additional measures are insufficient to absorb the direct hit to GDP growth. Investors run for cover under this scenario, as reflected in the equity market being 5.29 percentage points below the no-tariff baseline in 2019 at just 0.49 percent, before partially recovering and rising to 8.6 percent in 2020, 3.2 percentage points stronger than the baseline. Capital outflows are expected to accelerate under this scenario, but concentrated efforts should keep the Yuan broadly steady through the brunt of the scenario in 2019.
Under this scenario, Asia’s important integrated supply chains are strained, and this is where the hit to GDP growth largely comes for remaining countries, since they are not directly subject to the U.S. tariffs.
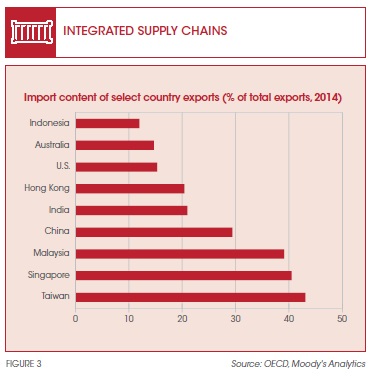
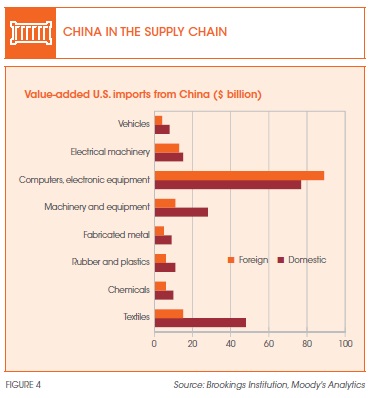
Examining the import content of exports illuminates the extent to which a country is a user of foreign inputs, and for most economies in Asia, this is relatively high (refer to Figure 3). Value-added trade data from the Brookings Institution confirm that in the case of the ‘computers, electronic equipment’ category, there is more foreign value-added than domestic value-added in Chinese exports to the U.S. (Figure 4). In other words, technology intermediaries play a greater role in producing goods in this category that are shipped to the U.S. than China does. This is important because those economies that are important tech hubs throughout Asia, including Taiwan, Malaysia, Hong Kong and Singapore, inevitably suffer from tariffs on Chinese technology imports to the U.S. simply because of their role in the supply chain.
Under this scenario, the worst of the hit to GDP growth occurs in 2019. Hong Kong’s GDP growth is reduced by 0.62 percentage point below baseline levels to 0.9 percent in 2019. Singapore’s GDP growth hits 1.7 percent in 2019, 0.23 percentage point below the baseline. Malaysia endures a similar magnitude slump with annual GDP growth hitting 3.95 percent under the scenario.
Some Chinese parts that are currently shipped directly to the U.S. could be redirected via Southeast Asia to avoid tariffs, but whether this would be a boon for Southeast Asia in the near-term is unlikely, given that manufacturing is still taking place in China. In the medium to longer term, China could accelerate offshoring to some parts of Southeast Asia, where labour and operating costs are lower, but this would not be enough to offset the direct hit from lower trade flows. GDP growth in export-dependent Taiwan is expected to cool to 2.1 percent in 2019, 0.35 percentage point below the no-tariff baseline as its heavy exposure to electronics makes it particularly vulnerable to this protectionist stance.
The marked reduction in global trade flows sees commodity prices take a hit, with Brent oil falling to around US$60 per barrel by the end of 2019. Weaker commodity prices flow through to weaker export receipts for Australia and Indonesia. Australia’s GDP growth is reduced by 0.23 percentage point in 2019 to 2.5 percent, before returning to near the no-tariff baseline growth rate in 2020. Meanwhile, Indonesia’s GDP growth is 0.15 percentage point lower in 2019 at 4.62 percent, but by 2020 comes in at 5.0 percent, 0.41 percentage point above baseline.
Exchange rates in all countries except Hong Kong and Singapore act as a partial shock absorber, but are unable to completely absorb the hit to exports. Modest monetary easing comes into view for these Asian countries from 2018 with policy rates not returning to no-tariff baseline levels until after 2023.
Trade conflagration scenario (10 percent probability)
It would take a lot to derail the expansion, yet an across-the-board hike in tariffs on U.S.-China trade could do it. The U.S.-China trade relationship is the largest in the world, with Chinese exports to the U.S. running at more than US$520 billion per year—more than one-fifth of total U.S. imports. U.S. exports to China total more than US$130 billion—close to one-tenth of total U.S. exports.
A scenario that includes a 25 percent tariff on all this trade, coupled with Chinese ‘qualitative’ measures that complicate doing business in China for American companies, would overwhelm global economic expansion. China could take a range of qualitative steps, from more aggressive inspections of U.S. imports to stiffer visa requirements for visiting American workers, to ensure that they match the economic pain created by the U.S. tariffs on their products.
In this scenario, the U.S. economy descends into recession by the second half of 2019. The increase in import prices and accelerating inflation and decline in exports would overwhelm U.S. expansion, particularly since the entire global economy and financial markets would also be reeling. Real GDP is cut by 1.8 percentage points at the economy’s nadir at the start of 2020, costing the economy almost 2.6 million jobs. Unemployment rises to well over five percent.
The rest of the global economy suffers, although a stronger U.S. dollar moderates the blow somewhat. The economic and political turmoil created by the trade war causes a sell-off in global financial markets and a risk-off environment. Global investors flock to the safety of U.S. treasury bonds, resulting in an appreciation of the U.S. dollar against most other currencies, most notably vis-a-vis the Euro and the Yuan. Therefore, the Chinese economy ironically weathers the trade war storms more gracefully than the U.S.
In this trade war scenario, real GDP growth in Asia is reduced by around 0.24 percentage point in 2018 and 0.92 percentage point in 2019 before recovering modestly in 2020. In this scenario, China’s GDP growth drops by 1.19 percentage points to 5.28 percent in 2019 and 0.19 percentage point to 5.6 percent in 2020. The marked deterioration through 2020 causes significant reduction in manufacturing output, spilling over to weaker employment and income growth. Government stimulus steps up on both a fiscal and monetary front but is unable to materially help the economy get back on track and GDP growth stays below the no-tariff baseline level until 2021.
China’s stock market falls sharply in this scenario, declining by 9.4 percent in 2019, and the Yuan remains below baseline levels through 2023, hitting a low of 6.5 per U.S. dollar in 2021. The weaker Yuan forces the current account surplus to narrow, acting as a secondary channel by which investors turn more bearish on China as they question the health of key economic metrics.
Asia is swept up in the dire situation and important supply chains come under severe strain. Reduced global demand, coupled with the heightened inability to source key components, means that Asia’s technology producers have their otherwise upbeat growth trajectories knocked off course. Similar to the proposed tariff scenario, the worst of the hit to GDP growth occurs in 2019. Hong Kong’s GDP growth is reduced by 1.26 percentage points to 0.3 percent in 2019. Singapore’s GDP growth slows to 1.7 percent in 2019, 0.36 percentage point below baseline. Malaysia endures a similar magnitude slump with annual GDP growth slowing by 0.33 percentage point to 3.9 percent in 2019. Annual growth in Hong Kong and Singapore remains below the no-tariff baseline rate until 2021, while Malaysia returns to near baseline growth rates in 2020.
In all these Asian countries, China is their largest export partner, ensuring a high vulnerability to this scenario. An added hit comes from higher policy uncertainty, raising the cost of capital and causing businesses to delay hiring and investment. The resulting slump in wages weighs heavily on consumption.
Commodity producers are also not immune. Markedly reduced global demand drives down commodity prices, weakening an important source of income for Australia and Indonesia. In this trade conflagration scenario, Brent oil falls to around US$51 per barrel by the end of 2019. Firms abandon investment plans and cut employment to try and stay afloat through the turmoil. The unemployment rate in Australia peaks at 5.3 percent in 2019. Indonesia’s unemployment rate rises to 5.2 percent in 2019, modestly higher than the baseline.
Australia’s annual house price growth slumps to 2.4 percent in 2019, weaker than the no-tariff baseline projection of 3.48 percent with the resulting weaker wealth effects providing a further hit to consumption.
A broad-based slowdown in trade will cause India’s foreign direct investment (FDI) to fall. FDI remains a key source of funding for various Indian companies, and a slowdown in foreign flows means investment is likely to decelerate. Overall investment in India is already low, and a further slowdown will adversely impact the capital expenditure cycle. Less capital inflows will likely see the rupee depreciate, as the currency remains vulnerable to capital flight due to India’s high reliance on external funding. Although large unilateral trade sanctions are unlikely against India, there is a risk that the country could turn more protectionist. For example, India recently retaliated with its own tariffs against U.S. products in response to import duties on steel and aluminium imposed by the U.S. This will likely lower Indian imports, which could further hinder the capital expenditure cycle.
Equity markets are a decent barometer of the risk aversion that has swept through global financial markets, and large falls are recorded across all markets. Stock markets across the Asia-Pacific region will endure steep double-digit declines in 2019. Currencies fare similarly but are unable to fully absorb the hit to exports.
Mark Zandi
is Chief Economist at Moody’s Analytics
Steve Cochrane
is Chief APAC Economist at Moody’s Analytics
Ryan Sweet
is Director of Real-Time Economics at Moody’s Analytics
Ruth Stroppiana
is Director of Economic Research at Moody’s Analytics
Katrina Ell
is Assistant Director of Economic Research at Moody’s Analytics
1. The scenarios are based on Moody’s Analytics Global Macroeconomic Model, which covers more than 70 countries linked via trade flows, foreign direct investment, and financial markets.
Last updated on 04 Dec 2019 .